SaaS Signup Flow Optimization: What the Data Shows
Discover what the data actually shows about SaaS signup flow optimization, friction reduction, and trial conversion benchmarks your growth team needs to know.
The Honello TeamUpdated 7 min read
If your SaaS signup flow is leaking users, you are not alone. The average SaaS trial conversion rate sits somewhere between 2% and 5%, and the difference between the bottom and top of that range often comes down to how much friction lives inside the signup experience. Not your product. Not your pricing. Your flow. The good news is that friction is fixable once you know where to look, and the data gives us a pretty clear picture of what actually moves the needle.
Why Signup Flow Optimization Matters More Than You Think
Most SaaS founders obsess over acquisition. They tweak ad copy, A/B test landing page headlines, and pour money into paid channels. Then they send hard-won traffic to a signup flow that quietly kills conversions at every step. It is like filling a bucket with a hole in the bottom and wondering why it never gets full.
Research from Totango and other SaaS analytics firms consistently shows that users who experience friction in the first few minutes of a trial are significantly less likely to reach the activation milestone, which is the moment they first get real value from the product. No activation means no conversion. And no conversion means every dollar spent on acquisition is doing half the job it should be.
The signup flow is not just a form. It is the first product experience your user has. It sets expectations, signals professionalism, and either builds or erodes trust before the user has even seen what your software can do.
What the Data Says About Friction in Trial Flows
Let’s get specific, because vague advice about “reducing friction” is not useful. Here is what the research actually shows.
Form Field Count Has a Direct Impact on Completion Rates
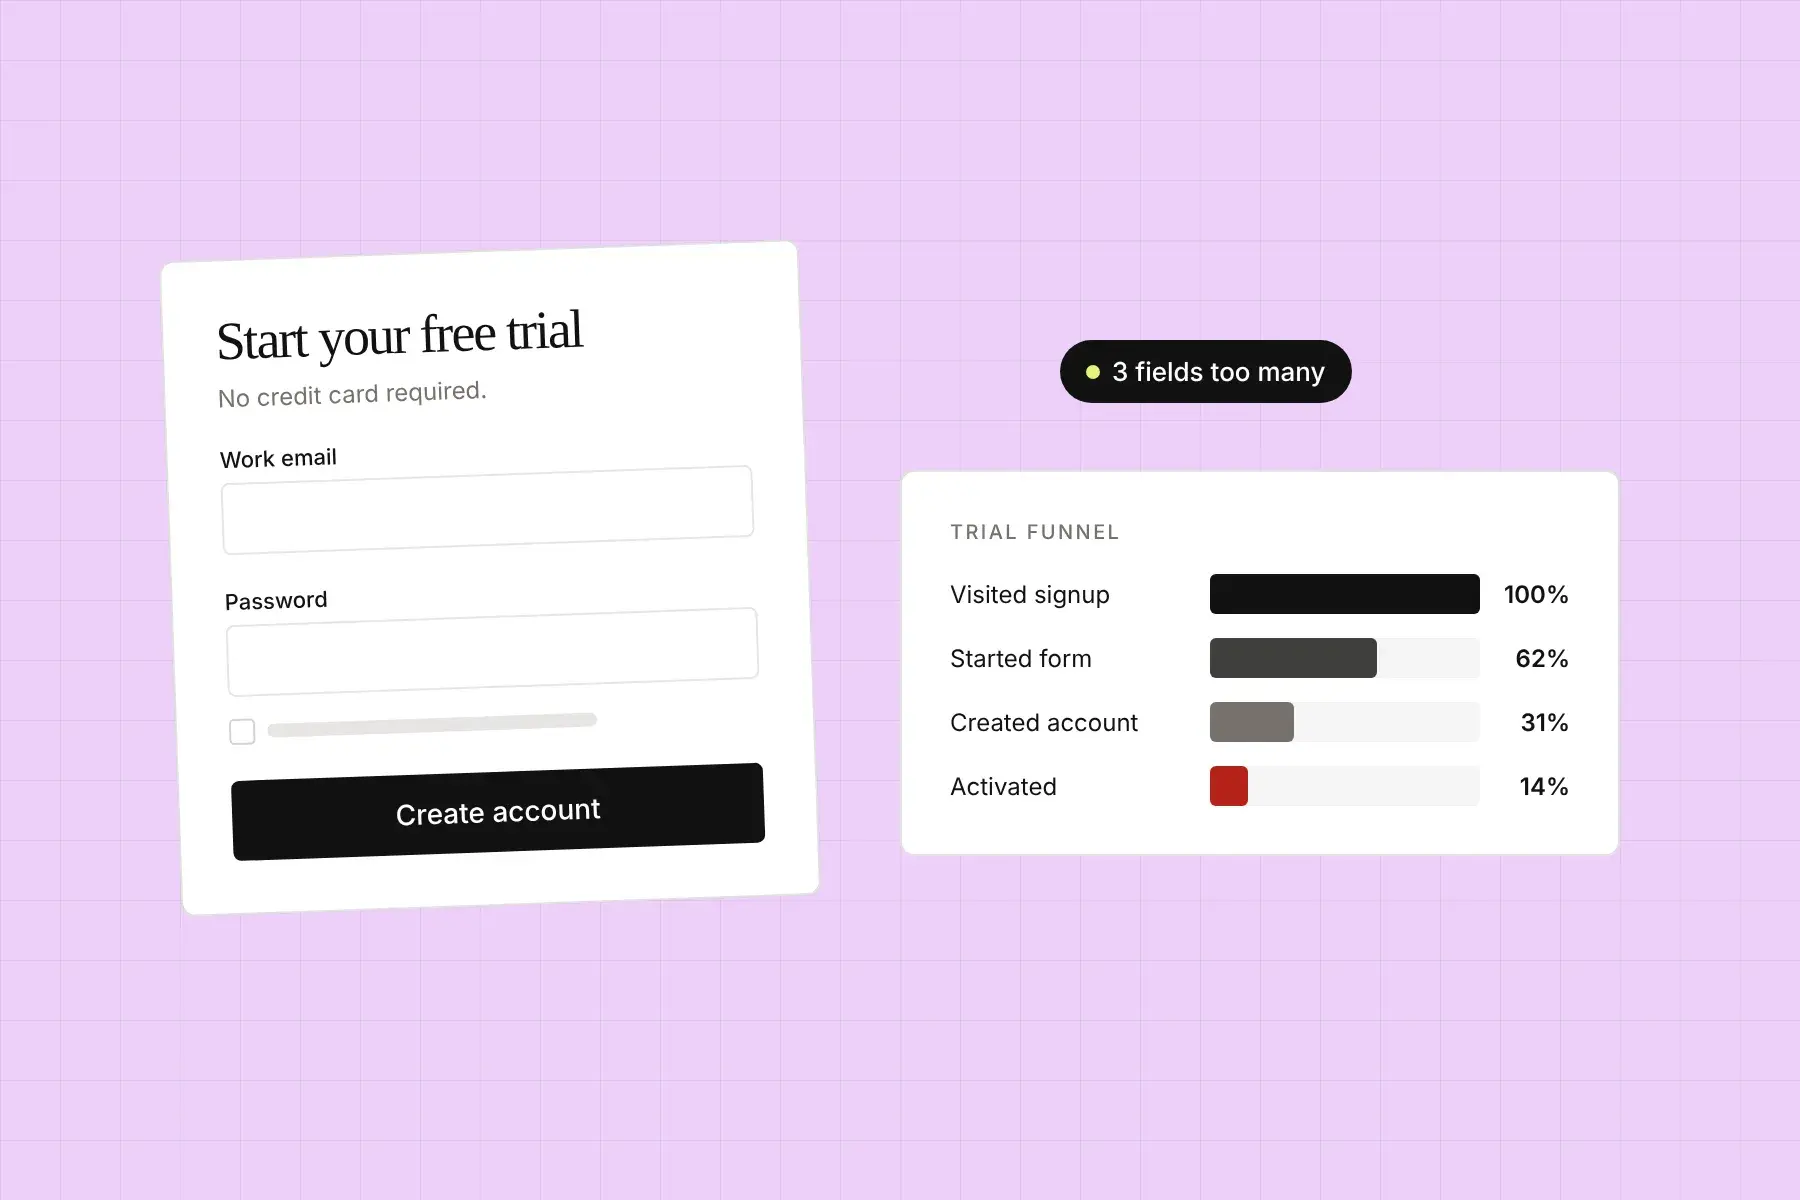
Studies across SaaS signup flows consistently show that reducing the number of required fields increases completion rates. Going from 11 fields down to 4 can increase conversions by over 120% in some cases. The benchmark most growth teams shoot for is three to five fields at most for initial signup: email, password, and maybe a company name. Everything else can wait until the user has experienced value.
This is the logic behind progressive profiling, where you collect information in stages rather than all at once. Ask for the minimum needed to get the user into the product, then gather more context over time as they engage. Users who are already getting value are far more willing to share additional information.
Social Login Reduces Drop-Off Significantly
Offering Google or Microsoft OAuth as a signup option regularly improves conversion rates by 15% to 30% depending on the audience. For B2B SaaS especially, where Google Workspace accounts are ubiquitous, removing the friction of creating and remembering a new password is a meaningful quality-of-life improvement. The data supports this clearly: the faster a user gets from intent to inside the product, the better.
Email Verification Is a Conversion Killer When Mishandled
Required email verification before accessing a trial is one of the most common friction points in SaaS flows. Some platforms see 20% to 40% of users drop off at this step. The fix is not to remove verification entirely but to either let users access a limited version of the product before verifying, or to send the verification email with a warm, clear message that sets expectations and makes clicking it feel worthwhile.
First Impressions Set the Tone Before Anyone Clicks Signup
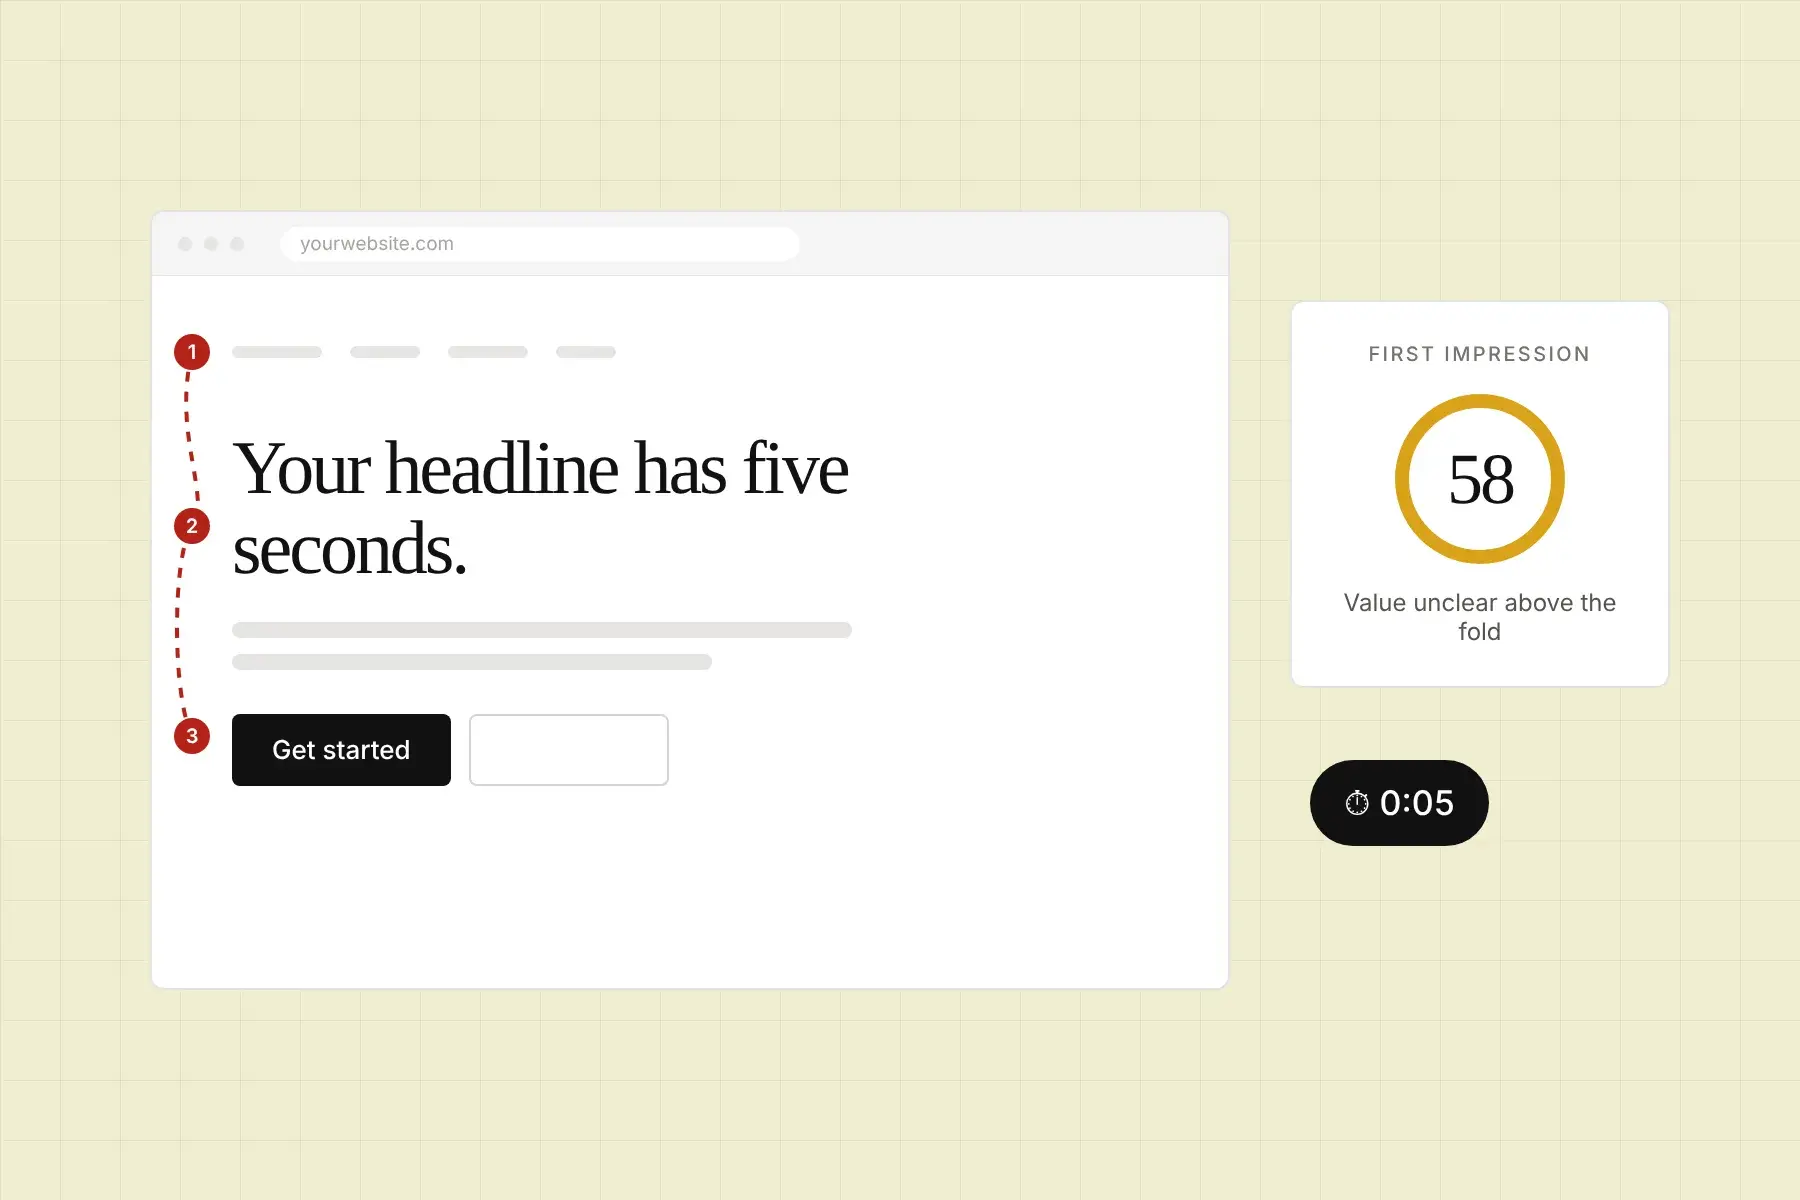
Here is something growth teams often overlook: the signup page itself has a UX and trust problem that starts before the user even fills out the first field. If the page looks outdated, confusing, or untrustworthy, users bail before they type anything. Your conversion rate is being influenced by visual hierarchy, social proof placement, and CTA clarity long before form completion enters the picture.
This is where a lot of optimization efforts stall out. Teams are split-testing button colors while the actual issue is that the page has no visible trust signals, a vague headline, and a CTA that does not tell the user what happens next. “Get Started” means nothing. “Start Your Free 14-Day Trial” means something.
Trust Signals Are Not Optional
Research from Nielsen Norman Group and CXL consistently shows that trust signals, like customer logos, review badges, security certifications, and testimonials, placed near the signup form can meaningfully increase conversion rates. The closer they are to the action you want the user to take, the more effective they are. A G2 or Capterra badge placed directly beneath the signup button is not just decoration. It is doing conversion work.
For SaaS products targeting teams or enterprises, adding a short line about data security right next to the signup form can also reduce hesitation. Something like “No credit card required. Your data is encrypted and never shared” addresses objections at the exact moment they arise.
Mobile Signup Flows Are a Separate Problem
A surprising number of SaaS teams build a solid desktop signup experience and then forget that a meaningful portion of their traffic is coming from mobile devices. B2B SaaS is not immune to this. Decision-makers read newsletters, click ads, and research tools on their phones constantly. If your signup flow is a nightmare on mobile, you are losing real prospects.
The mobile-specific data is sobering. Pages with unoptimized form inputs, tiny tap targets, or layouts that require horizontal scrolling see significantly higher abandonment rates than their desktop counterparts. Mobile users are also much less patient. If something feels off in the first few seconds, they are gone.
Specific things to audit on mobile: input field sizing, keyboard type triggers (are you showing a numeric keyboard for a phone number field?), autofill compatibility, and whether your CTA button is thumb-friendly and above the fold. These sound small but they add up fast.
Onboarding Flows Are Part of the Signup Equation
The signup flow does not end when the user submits the form. What happens in the first two to five minutes inside your product is still part of the conversion funnel. Users who hit a blank dashboard with no guidance convert to paid at dramatically lower rates than users who are walked through a clear first action.
Products like Slack and Notion have invested heavily in onboarding checklists and empty state design precisely because the data shows that users who complete a setup milestone within the first session are far more likely to activate and eventually pay. If your product drops users into a blank canvas and expects them to figure it out, you are leaving conversions on the table regardless of how smooth your actual signup form is.
Progress Indicators Reduce Abandonment Mid-Flow
If your signup or onboarding flow has multiple steps, showing a progress indicator reduces abandonment. This is well-documented in both ecommerce checkout research and SaaS onboarding studies. People are more willing to complete a process when they can see the finish line. A simple “Step 2 of 3” label does real psychological work.
How to Audit Your Signup Flow Without Guessing
Most growth teams audit their signup flow by looking at funnel drop-off data in Mixpanel or Amplitude and trying to infer what is wrong. That is useful but incomplete. Drop-off data tells you where people leave. It does not tell you why, and it definitely does not tell you what the experience looks and feels like to a first-time visitor who has never heard of your product.
That gap between analytics data and actual user experience is where a lot of optimization potential hides. Visual confusion, trust gaps, and poor CTA clarity do not always show up as dramatic funnel drops. They show up as slightly lower conversion rates that compound quietly over months.
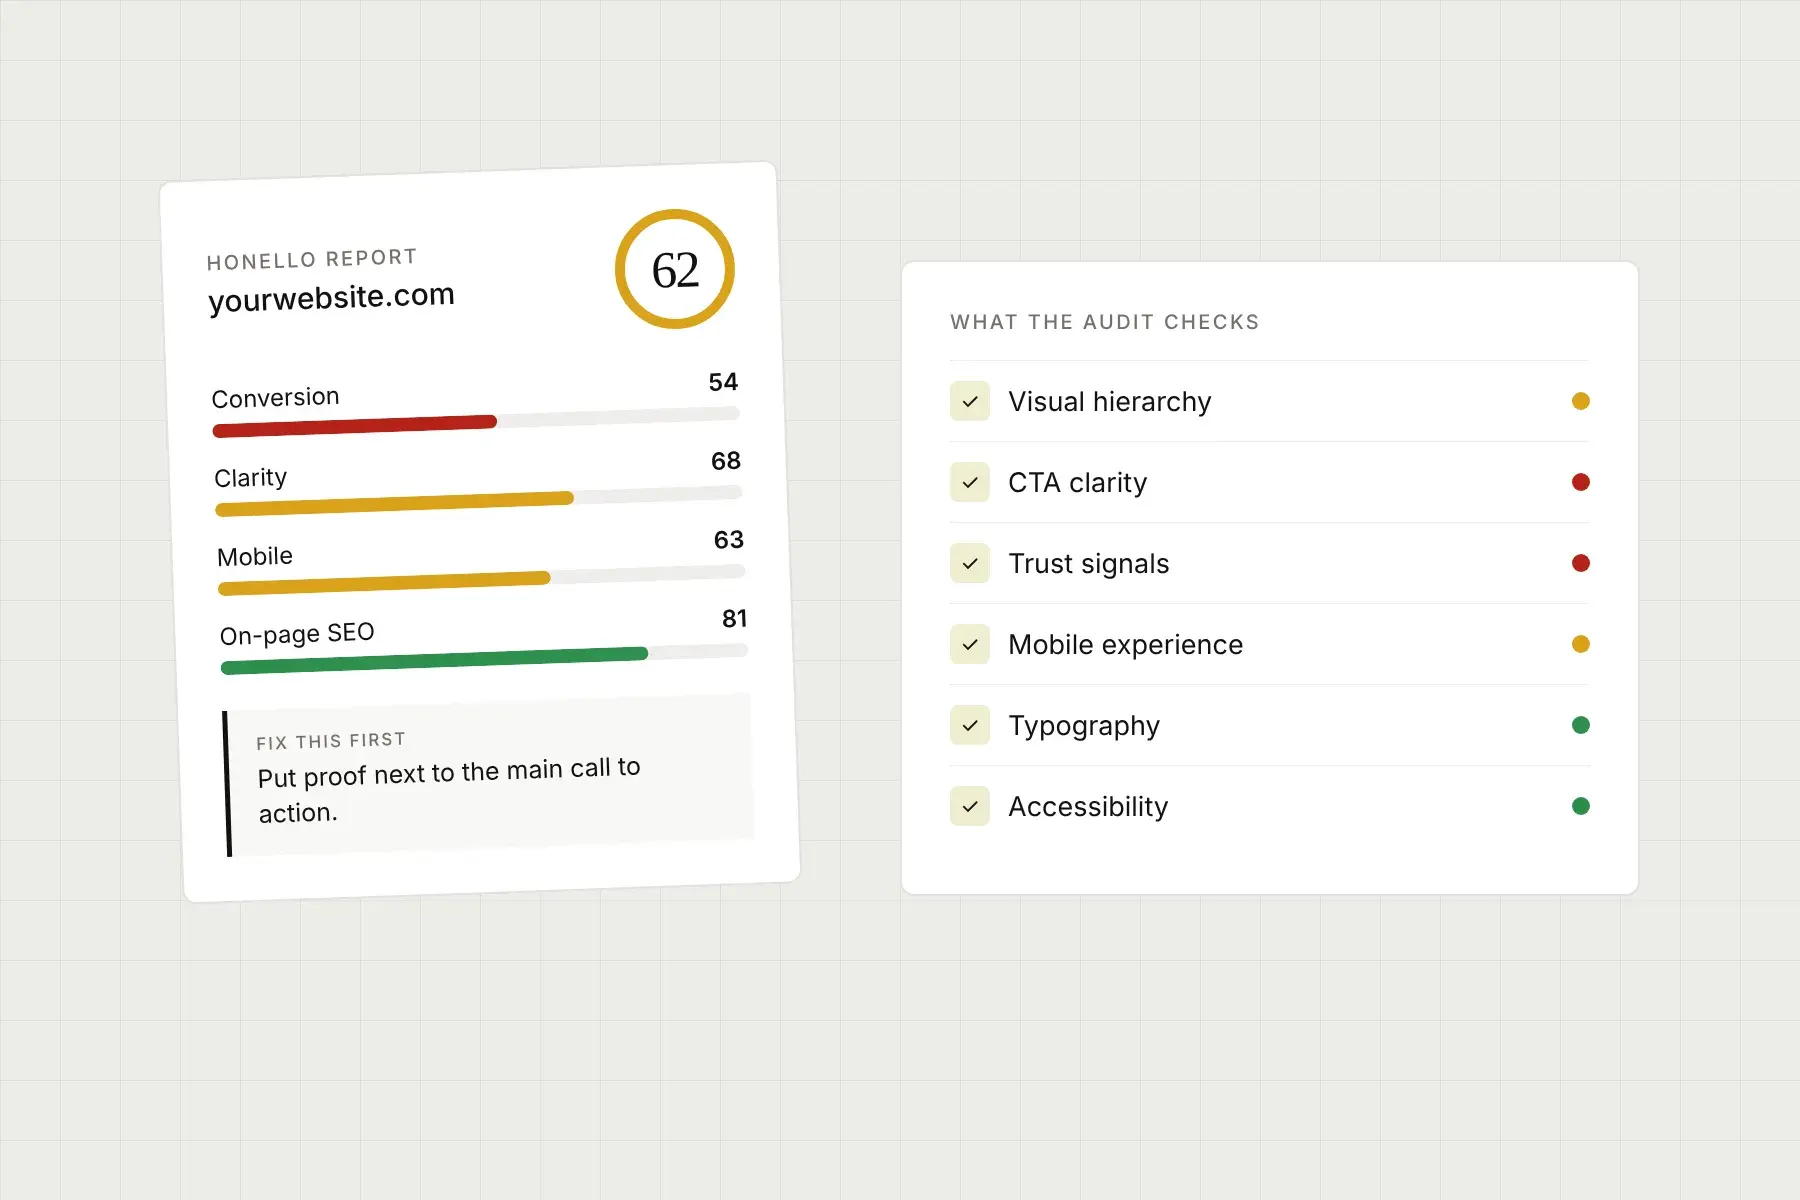
This is exactly the kind of problem that Honello was built to surface. You submit your URL, and Honello’s AI captures what visitors actually see on both desktop and mobile, then evaluates the experience against established UI and UX principles. It scores your page across more than ten dimensions including visual hierarchy, CTA effectiveness, trust signals, and first impression clarity, and delivers a prioritized list of specific fixes starting with the single highest-impact change. No installs, no code, no 80-page report that nobody reads. Just clear, ranked, actionable findings you can hand straight to your developer.
For SaaS teams trying to optimize their signup or trial flow, that kind of outside perspective is genuinely valuable. It is easy to go blind to your own product after staring at it for months. A fresh AI-powered audit often surfaces issues that have been sitting there the whole time, quietly costing you conversions. You can explore what Honello offers at honello.com/pricing or get started right now at honello.com/sign-up.
The Benchmarks Worth Tracking
If you are trying to evaluate where your flow stands, here are the numbers worth knowing heading into 2026. A healthy free-to-paid trial conversion rate for product-led SaaS sits between 15% and 25% for well-optimized products. Signup page conversion rates (visitor to trial) vary widely but a strong benchmark is 10% to 25% depending on how qualified your traffic is. Mobile form completion rates typically run 10% to 20% lower than desktop if the flow has not been specifically optimized for small screens.
If your numbers are below these ranges, the issue is almost certainly findable. The data shows that signup flow problems are not mysterious. They are specific, they are visible, and they are fixable with the right information. The teams that win at trial conversion are not the ones with the most budget. They are the ones who have actually looked at their flow the way a new user does, found the friction, and removed it.
See what your visitors see.
Run a free scan and get a prioritized list of conversion, SEO, and UX fixes for your site in under 5 minutes.